Saw a post on dzone about setting up the Zend Debugger for use with PDT. It inspired me to finally try this out.
Installing PDT and Zend Debugger (client) is easy -- just add these two Update sites to your Eclipse and grab all the updates:
http://download.eclipse.org/tools/pdt/updates/
http://downloads.zend.com/pdt/
After restarting, you can do console php debugging as shown in in the above article. Very cool -- breakpoints & console work as expected, and you can step in/over/though code and see variables, just like with the JDT debugger for Java code.
Getting PHP web debugging to work took a little more effort. This is partly because of my eclipse.org sandbox setup, but also because I didn't RTFM properly. Also, I encountered an editor management bug which might be related to how Mylyn and the Auto-pin Tweaklet play together.
Anyway, after breaking with tradition ("hack first, ask questions later") and actually checking in a newsgroup for help, I found a link to Installing the Zend Debugger Server. Server installation was straightforward -- just grab the latest server code and unpack it into /opt or similar, and follow the steps in the install guide / README.
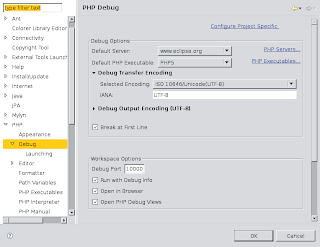
Then I had to simply configure PDT a little...
... toggle my /etc/hosts file, and launch a project web page (ALT-SHIFT-D, W) to try it out.


3 comments:
Thanx, I needed this.
I am searching regarding Offshore Software Development Company and found your blog which is quite awesome and have useful information.
I use Codelobster PHP Edition for it
It has great free PHP bedugger
Post a Comment